
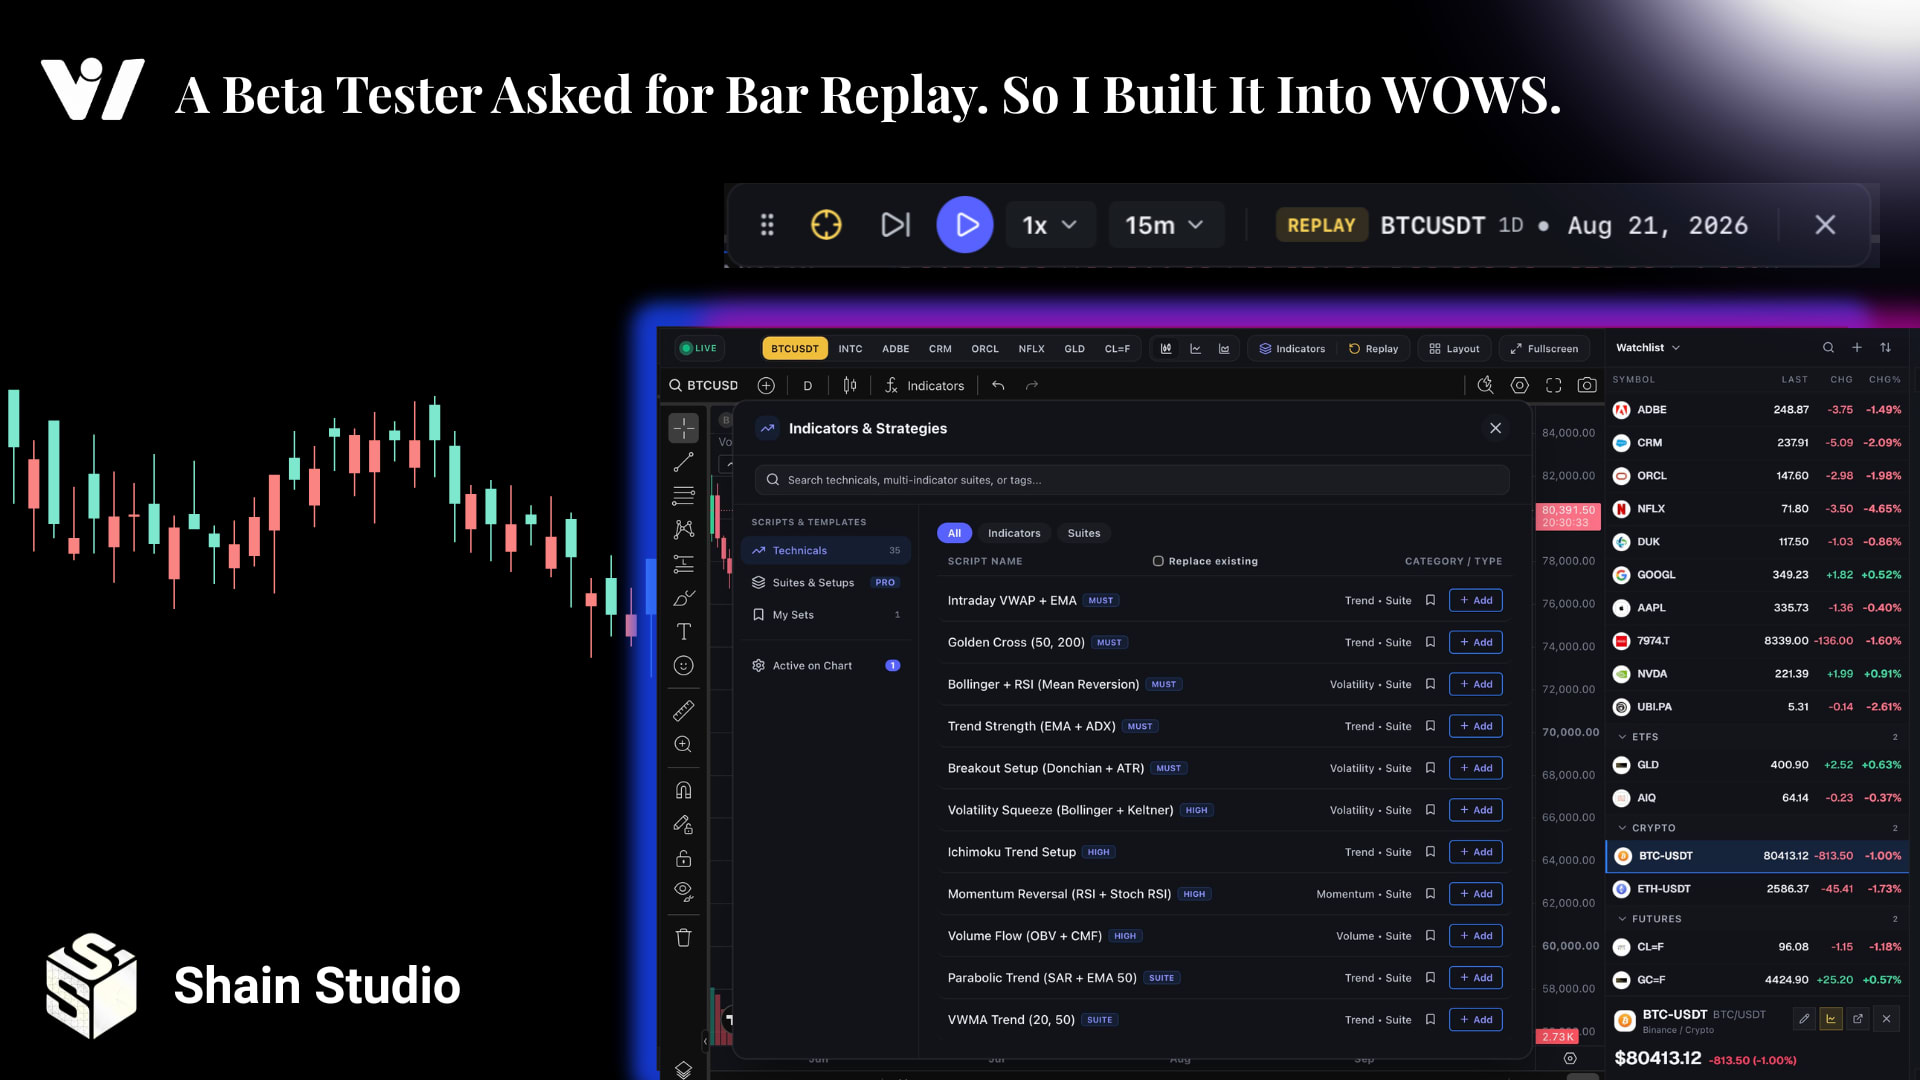
A beta tester asked for Bar Replay in WOWS. What sounded like a small chart feature turned into an interesting problem involving historical data, realtime subscriptions, progressive candle formation, multi-chart isolation, and reusable indicator setups.
Tags
A Beta Tester Asked for Bar Replay. So I Built It Into WOWS.
One of the parts I enjoy most about putting an unfinished product in front of real people is that they rarely care about the roadmap in your head.
They just use it.
And then they ask for the thing that feels obviously missing.
That happened while I was testing WOWS, my market research and charting platform.
One of the beta testers wanted a way to go back to a historical point on a chart and replay what happened from there.
Basically:
“Can I replay the market instead of looking at the finished chart?”
That was enough to send me down a new branch of the project.
The funny thing is that Bar Replay sounds simple.
Hide the candles on the right. Add a play button. Reveal them one at a time.
And at the most basic level, that is Bar Replay.
But making it feel like a natural part of an actual market terminal was a much more interesting problem.
The first version worked — and I immediately disliked it
My first mental model was straightforward:
Choose historical candle
↓
Hide everything after it
↓
Press Play
↓
Send the next historical bar
↓
Repeat
Technically, that works.
Visually, it felt terrible.
A completed candle would suddenly appear on the chart with its final open, high, low, close, and volume.
Then another.
Then another.
It felt less like watching a market and more like clicking through presentation slides.
That became the first real design constraint:
Replay shouldn't just reveal history. It should feel like history is unfolding.
So instead of treating every historical candle as an object that simply appears, I started treating the current replay candle as a forming realtime bar.
The same timestamp gets updated repeatedly while the candle develops.
Once it finishes, Replay moves to the next timestamp.
That small distinction changed the whole feature.
Working with the chart instead of fighting it
WOWS uses TradingView Advanced Charts, but the market data and application state around it are my own.
I didn't want Replay to become a completely separate chart implementation.
That would mean maintaining one system for live charts and another for historical simulation.
Instead, I built a pane-specific datafeed adapter around the existing feed.
Its job is essentially to sit between the chart and WOWS' normal data source:
TradingView Chart
       ↓
PaneDatafeedAdapter
       ↓
WOWS Datafeed
During normal usage, it mostly passes requests through.
During Replay, it changes the rules.
Historical requests are clamped to the current replay timestamp.
Future candles aren't allowed through.
Live market updates are temporarily suppressed for that pane.
And if the current candle is still forming, the datafeed returns the partial version instead of accidentally exposing its completed historical value.
This became especially important when panning or zooming.
It would be a pretty bad replay system if you could simply drag the chart slightly to the right and reveal the future.
Then came the candle animation problem
Once future data was properly hidden, I wanted the active candle to move instead of suddenly appearing.
For completed historical bars, I already know:
Open
High
Low
Close
Volume
But knowing those five values doesn't tell me exactly how price moved inside the candle.
If a daily candle opened at 100, traded as low as 95, reached 108, and closed at 106, the OHLC data doesn't tell me whether 95 happened before 108.
So there are two approaches.
The first is synthetic interpolation — build a deterministic path through the known OHLC values and progressively update the candle.
That gave WOWS smooth candle formation quickly and works well when only the parent timeframe data is available.
The better approach is to use lower-timeframe historical bars.
For example:
Chart: 1D

Replay data:
09:30
09:45
10:00
10:15
...
Those smaller historical bars can progressively aggregate into the same daily candle.
Now the daily candle isn't just being animated toward its final state.
It's being reconstructed from actual historical intrabar data.
That also led to an important separation in the Replay system:
Replay Speed determines how frequently the simulation advances.
Replay Interval determines how much historical market time each update represents.
Those sound like the same thing until you build a replay engine.
They aren't.
Multi-chart support made things more interesting
WOWS supports multiple chart panes.
That meant Replay couldn't be one global boolean like:
isReplayMode = true;If I replay Bitcoin on the left pane, there is no reason a live stock chart on the right should suddenly travel backwards in time too.
So every chart pane gets its own:
Replay controller
datafeed adapter
playback state
historical boundary
forming candle
realtime subscription handling
Subscriptions also need to be namespaced so two TradingView widget instances don't accidentally collide.
This is one of those details users should never have to know exists.
Which is usually a good sign that it belongs in the architecture.
Pause turned out to be more interesting than Play
One of my favorite bugs during this work happened when pausing Replay halfway through a forming candle.
Initially, pausing correctly stopped the animation.
But pressing Play again could begin reconstructing the candle from its opening state.
The chart effectively jumped backward before continuing.
The solution was to persist the animation itself:
final bar
current progress
current forming state
Pause cancels the active animation loop but doesn't destroy that state.
Resume continues from the exact point where the candle stopped.
I also added generation counters around playback and Replay lifecycle operations so old asynchronous work can't come back later and mutate a newer Replay session.
That sounds like overkill until someone rapidly does:
Play
Pause
Change interval
Jump to another candle
Play
Exit Replay
which, naturally, is exactly what someone eventually does.
The same update also changed how indicators work
While working on Replay, another part of the chart workflow was starting to annoy me.
Adding the same group of indicators repeatedly.
A chart might use:
EMA 20
EMA 50
RSI
Volume
Then I would change symbols and configure everything again.
So I built an indicator preset system alongside Replay.
WOWS now has curated setups for common technical-analysis workflows, but I didn't want users limited to combinations I chose.
That led to My Sets.
You can configure the chart however you like, including indicator settings and styles, and save that configuration as a reusable template.
Then apply it to another chart later.
The workflow becomes:
Build
↓
Customize
↓
Save
↓
Reuse
Much nicer than rebuilding the same chart repeatedly.
One feature request became a better chart architecture
None of the individual problems here were some impossible engineering challenge.
What made the project interesting was how many systems a seemingly small feature touched.
Bar Replay ended up involving:
historical data loading
realtime subscriptions
TradingView's datafeed lifecycle
timestamp normalization
intrabar aggregation
animation timing
async cancellation
multi-pane isolation
historical data retention limits
chart cache invalidation
React cleanup
indicator recalculation
And once those pieces were in place, several parts of WOWS became cleaner than they had been before Replay existed.
That's one of the things I like about building products this way.
A user asks for something concrete.
You follow the request far enough down the stack.
And sometimes the result isn't just another button.
It's a better system underneath it.
What WOWS supports now
The charting workspace now includes Bar Replay with progressive candle formation, multiple replay speeds and historical intervals, pane-scoped playback, curated indicator presets, active indicator management, and reusable saved Indicator Sets.
More importantly, they work together.
I can build a technical-analysis setup, save it, jump backwards in market history, and watch that same setup evolve as the historical data is revealed.
That's much closer to what I wanted WOWS charts to become in the first place:
not just a place to look at prices, but a workspace for actually exploring them.
And it started with one person testing the beta and asking for a feature.
This is probably my favorite kind of product work: a user asks for something that sounds small, and following that request properly forces the product to become better underneath.


